Introduction
In the relentless pursuit of faster delivery, many engineering organisations obsess over velocity, sprint completion rates, and deployment frequency. Yet teams often find themselves moving faster whilst delivering less value. The critical metric that bridges this gap is Lead Time to Value (LTTV) – the elapsed time from when work is requested until it delivers measurable value to customers or the business.
Unlike traditional metrics that measure activity, LTTV measures outcomes. It forces us to confront an uncomfortable truth: shipping features quickly means nothing if those features sit unused, solve the wrong problem, or take months to generate their intended impact.
Understanding Lead Time to Value
Lead Time to Value encompasses the entire journey from idea to realised benefit:
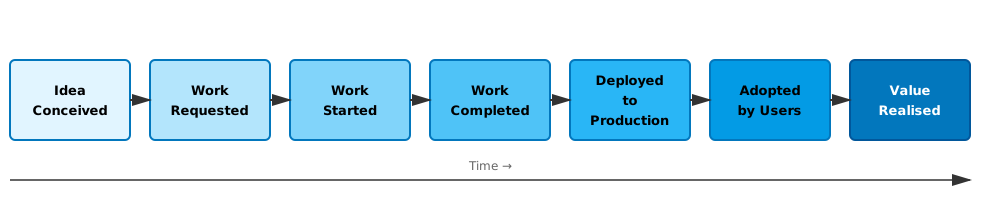
Most teams measure only the middle portion (work started to deployed), but LTTV forces us to track the entire value stream, including:
- Discovery time: From idea to validated requirement
- Development time: From work started to code complete
- Deployment time: From code complete to production
- Adoption time: From production to meaningful user engagement
- Value realisation time: From deployment to measurable business impact
The Hidden Costs: Common Pitfalls
1. The ‘Deployed but Dormant’ Trap
The Problem: Teams celebrate deployment as done, whilst features languish unused.
A financial services company deployed a new mobile payment feature, hit their deployment target, and moved on. Six months later, usage data revealed only 3% adoption. The feature had been buried four menus deep, had no onboarding, and solved a problem users didn’t actually have. The true lead time to value? Effectively infinite.
Warning Signs:
- Feature flags left permanently enabled without usage tracking
- No post-deployment monitoring beyond error rates
- Success defined by “shipped” rather than “used”
- Product and engineering celebrating different dates
2. Optimising the Wrong Bottleneck
The Problem: Teams focus on development speed whilst ignoring longer delays elsewhere.

Many teams optimise their 10-day development cycle whilst 90+ days of waste exist in requirements, deployment queues, and post-deployment validation.
3. The Batch Size Blindspot
The Problem: Large batch sizes create inventory that delays value realisation.
Consider two scenarios delivering the same scope:
Scenario A (Large Batches):
- 10 features bundled into one quarterly release
- First feature waits 3 months for the last feature
- Average LTTV: 6-8 months
Scenario B (Small Batches):
- 10 features deployed independently over 3 months
- Each feature delivers value immediately upon completion
- Average LTTV: 2-3 months
Same scope, radically different value delivery.
4. Measurement Theatre
The Problem: Teams measure proxies instead of actual value.
Common proxy traps:
- “We deployed 47 features” – How many are used? Which delivered ROI?
- “Our cycle time is 5 days” – From where to where? What about the 60 days before and after?
- “We achieved 95% sprint commitment” – Did those features create the expected value?
5. The Handoff Tax
The Problem: Each handoff adds delay and information loss.

In organisations with siloed teams, work spends more time waiting between teams than being actively worked on. The handoff tax compounds, with each transition adding queue time, context switching, and requirement re-clarification.
Strategies to Reduce Lead Time to Value
1. Make Value Visible Throughout the Workflow
Action: Extend your definition of done beyond deployment.
Create a value realisation checklist:
- [ ] Feature deployed to production
- [ ] Monitoring and analytics instrumented
- [ ] Users can discover the feature
- [ ] User adoption tracked (target: X users in Y days)
- [ ] Business metric impact measured
- [ ] Learning documented and shared
Implementation:
Story Status: Deployed ✓ | Adopted ⏳ (12% of target) | Value Measured ✗
Time in Production: 8 days | Target Adoption: 14 days | Value Metric: Not yet significant
2. Implement Continuous Discovery
Action: Eliminate large upfront requirements phases.
Instead of:
- 6-week requirement gathering phase
- Hand specifications to engineering
- Begin development
Do:
- Lightweight hypothesis definition (1-2 days)
- Rapid prototyping or experiments
- Build smallest testable increment
- Measure and iterate
This transforms requirements from a phase into a flow, reducing the discovery component of LTTV from weeks to days.
3. Decompose Work Ruthlessly
Action: Challenge every story to be smaller.
Ask:
- Can this be split by user workflow steps?
- Can we deliver a manual/wizard version first?
- Can we expose this to 5% of users before 100%?
- What’s the smallest thing that could prove or disprove our hypothesis?
Example Decomposition:
Original story: “As a user, I want advanced search with filters for date, category, price, and ratings”
Decomposed:
- Basic keyword search (validates search need)
- Single most-requested filter (validates filtering)
- Remaining filters (completes capability)
Each increment delivers value faster and provides learning to guide subsequent work.
4. Eliminate Deployment Friction
Action: Make deployment routine, not an event.
Deploy:
- Multiple times per day, not per sprint
- Automatically, not via change requests
- Behind feature flags for progressive rollout
- With automatic rollback on failure
A deployment should be easier than pushing to a git branch. If it isn’t, that friction is directly extending your LTTV.
5. Build Value Tracking into Your Workflow
Action: Instrument features for value measurement before development starts.
Define upfront:
- What user behaviour indicates adoption?
- What business metric should improve?
- By how much and in what timeframe?
- How will we measure it?
Implement tracking as part of acceptance criteria, not as an afterthought.
6. Create Full-Stack Flow
Action: Organise teams around value streams, not technical layers.
Instead of:
- Frontend team → Backend team → Data team → Platform team
Create:
- Cross-functional team owning entire customer journey
- Team responsible for delivery AND value realisation
- Minimal handoffs between ticket creation and value measurement
7. Limit Work in Progress (WIP)
Action: Finish work before starting more.
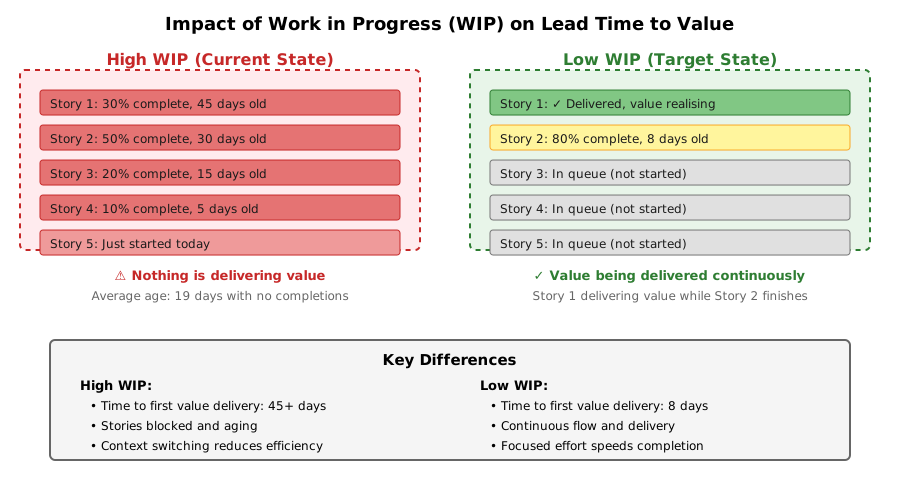
With high WIP, everything takes longer and nothing delivers value. With strict WIP limits, work flows faster and value is realised sooner.
8. Run Value Retrospectives
Action: After features launch, conduct value retrospectives.
Review:
- What was our predicted value and timeline?
- What was the actual adoption and impact?
- How long did it take to achieve target value?
- What delayed value realisation?
- What would we do differently?
This creates a learning loop that improves estimation and reveals systemic LTTV bottlenecks.
Measuring Lead Time to Value
Start simple:
Basic LTTV: Date value realised – Date work requested
Component Breakdown:
LTTV = Discovery Time + Development Time + Deployment Time + Adoption Time
Instrumentation:
- Start timestamp: When work enters your backlog or discovery begins
- Development milestones: Track state transitions (ready → in progress → review → done)
- Deployment timestamp: When code reaches production
- Adoption metrics: First meaningful user engagement (logged in, completed workflow, etc.)
- Value metric: When business KPI shows significant change
Sample Dashboard:
Feature: Advanced Search
━━━━━━━━━━━━━━━━━━━━━━━━━━━━━━━━━━━━━━━━━━━━━━━━━━━━━━━━
Requested:        2025-01-15
Started:          2025-02-03  (19 days wait)
Deployed:         2025-02-17  (14 days dev)
10% Adoption:     2025-02-24  (7 days to adoption)
Value Target Met: 2025-03-08  (12 days to value)
━━━━━━━━━━━━━━━━━━━━━━━━━━━━━━━━━━━━━━━━━━━━━━━━━━━━━━━━
Total LTTV:       52 days

Breakdown:
  Queue time:       19 days (37%)
  Development:      14 days (27%)
  Time to adoption:  7 days (13%)
  Time to value:    12 days (23%)
Getting Started: A Practical Approach
Week 1: Select three recent features. Reconstruct their journey from request to measurable value. Calculate LTTV and identify the longest delays.
Week 2: For new work, define value metrics upfront. Track them through delivery.
Week 3: Run a team workshop. Map your value stream. Identify the top three bottlenecks.
Week 4: Implement one change to address your largest bottleneck. Measure the impact.
Ongoing: Make LTTV visible. Include it in team retrospectives. Celebrate reductions in LTTV, not just deployment frequency.
Conclusion
Lead Time to Value forces uncomfortable questions: Are we building the right things? Are users adopting what we build? Is our work generating the expected impact? These questions lead to better outcomes than simply asking “are we moving fast?”
The teams that excel at LTTV share common characteristics:
- They measure outcomes, not output
- They optimise for learning, not prediction
- They deploy continuously, not periodically
- They own value realisation, not just code delivery
- They inspect their process relentlessly
Start measuring LTTV today. You’ll quickly discover that the path to faster value delivery looks quite different from the path to faster feature delivery. And in the end, value is what matters.
Remember: Every day a feature waits to deliver value is a day your organisation pays for work it hasn’t yet benefited from. Make the invisible visible, and optimise for what truly matters.